

A new report has been released by the University of Chicago, highlighting levels of public sector corruption in U.S. cities and states. It was co-authored by UIC professor and political advisor Dick Simpson and is based on an analysis of public corruption statistics from the Department of Justice. There was a grand total of 19,634 public corruption convictions across the United States over the past decade with 695 public officials, federal employees and government contractors convicted in 2018 alone.
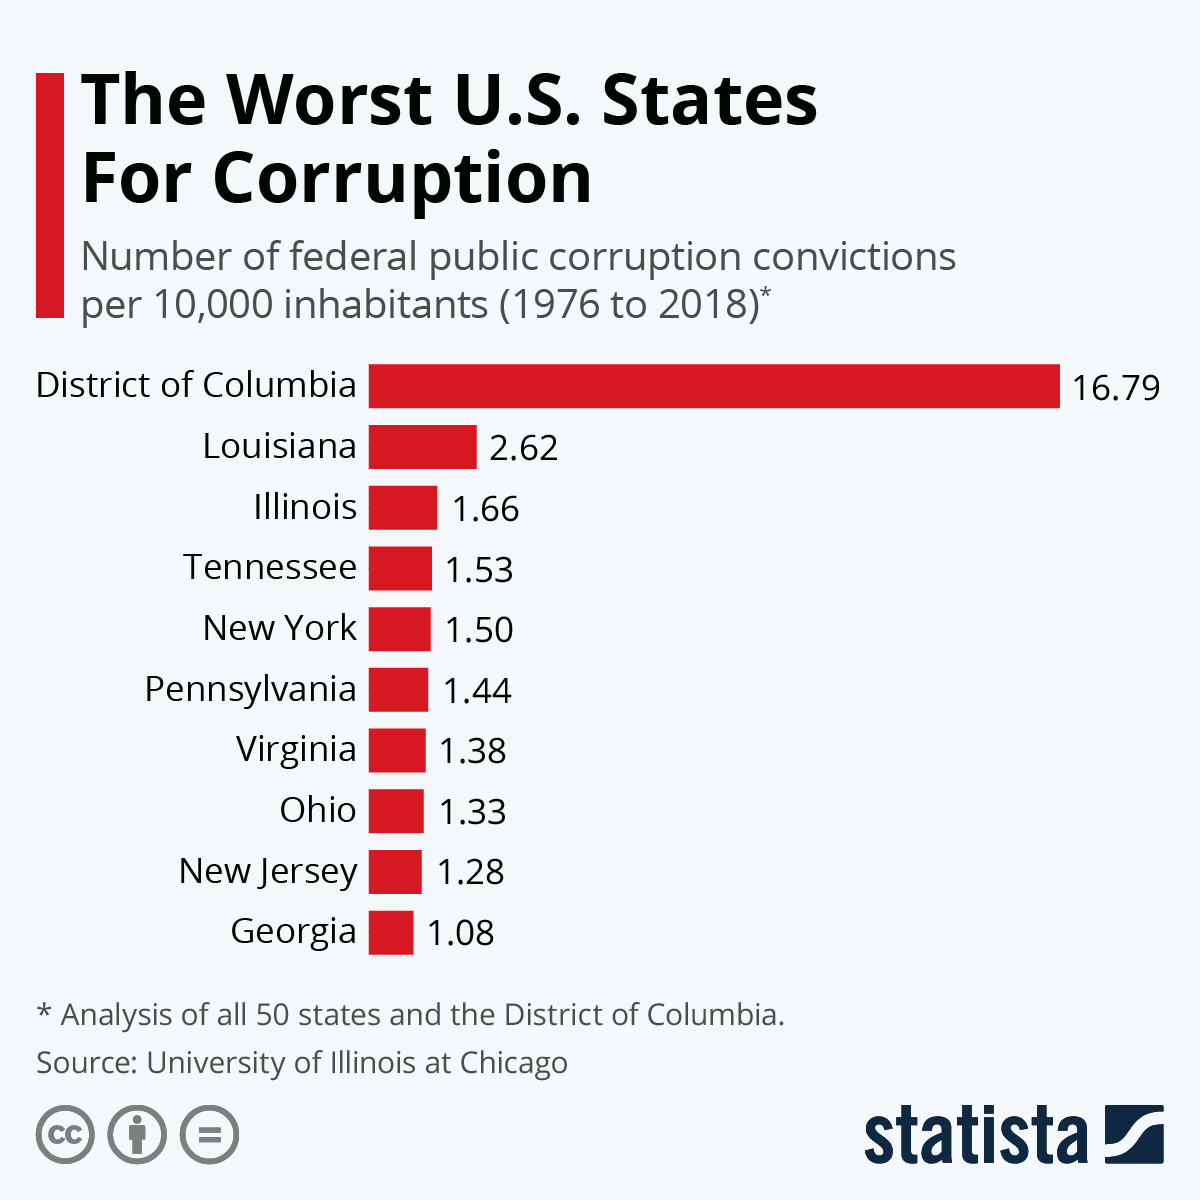
The report examined the problem across all 50 states and the District of Columbia, finding that D.C. had the highest number of public corruption offenses per 10,000 inhabitants between 1976 and 2018 with 16.79. That can be attributed to several factors including a comparably low population but also because it is the center of the national government and hosts the Department of Justice. That means nearly all of the country’s federal agencies are housed there with large numbers of government employees who can monitor and investigate potential offenses.
Louisiana comes second for corruption convictions per capital with 2.62 per 10,000 inhabitants while Illinois rounds off the top-three with 1.66. Its high position is due to the high number of offenses in Chicago which was once again named the most corrupt city in the country. The Illinois-Northern Judicial District recorded 1,750 public corruption convictions between 1976 and 2018 compared to second-placed Los Angeles’ 1,547.
 You will find more infographics at Statista
World Wide: Where Corruption Is Rampant
Transparency International released its 2019 Corruption Perceptions Index with the organization stating that despite anti-corruption movements gaining momentum around the world last year, a staggering number of countries have shown little to no improvement in tackling the problem. The index ranks 180 countries and territories on perceived public sector corruption with 0 meaning “highly corrupt” and 100 meaning “very clean”. This time around, more than two-thirds of countries scored 50 or below which means they have serious problems preventing foul play in their public sectors. The average global score was 43.
Denmark and New Zealand came joint-first with a score of 87 followed by Finland, Singapore, and Sweden. Somalia was rock bottom of the index with a score of just 9, followed by South Sudan and Syria with 12 and 13 respectively. Transparency International said that only 22 countries saw a significant improvement in their scores over the past eight years including Greece, Guyana, and Estonia. During the same time frame, 21 countries recorded a significant decrease with Canada, Nicaragua, and Australia among their ranks. The U.S. had a disappointing score of 69 this year, its worst score in eight years.
 You will find more infographics at Statista