
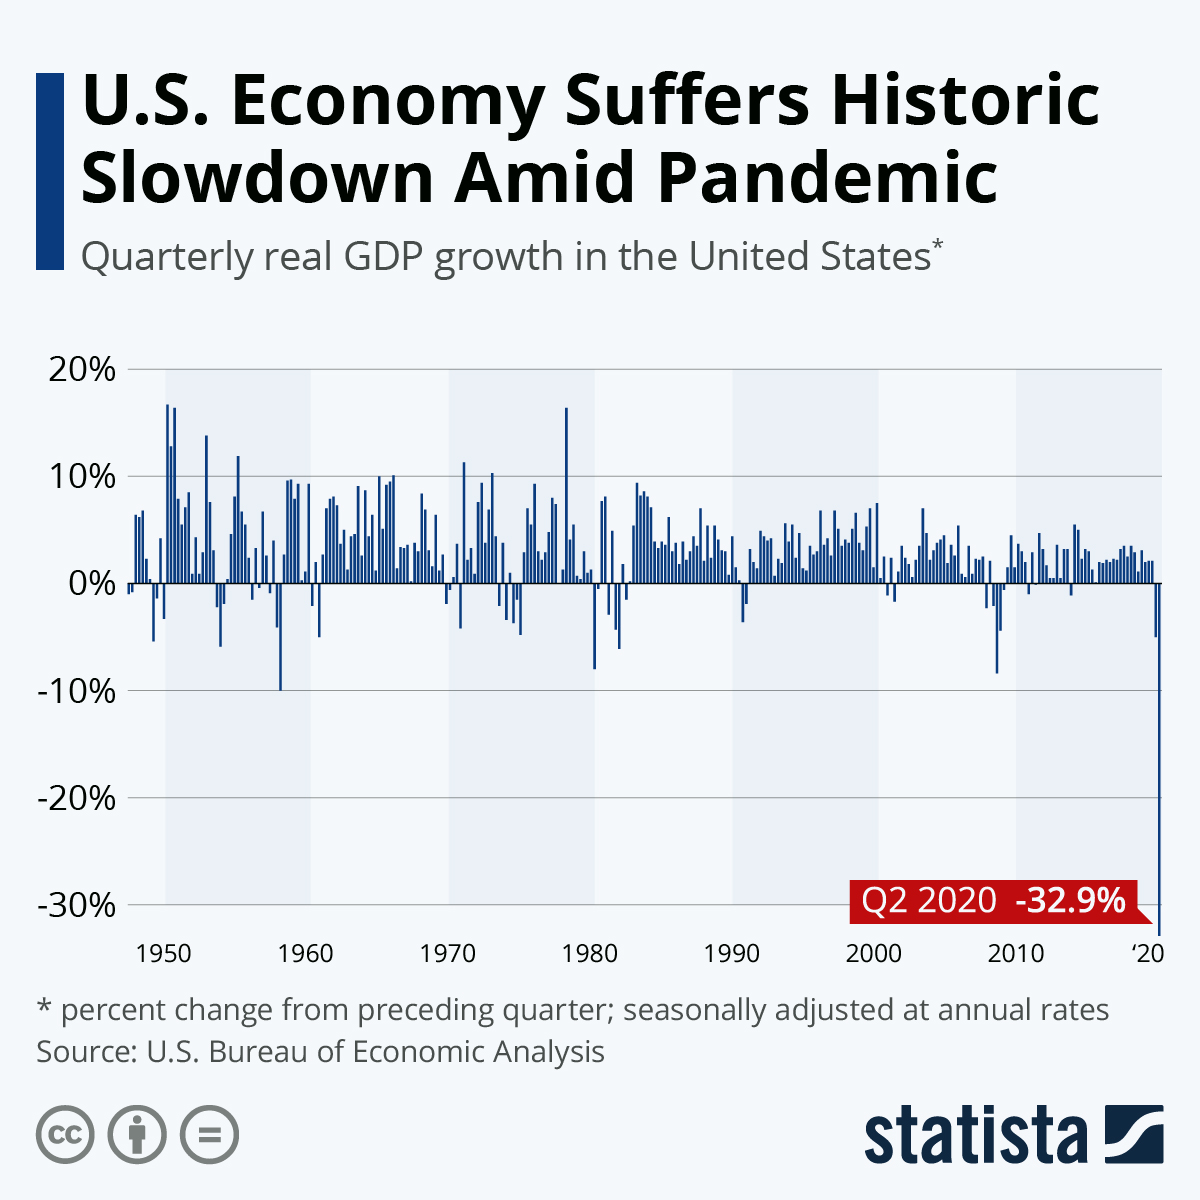
Coming on the heels of the first contraction after 23 consecutive quarters of growth, the U.S. economy suffered its steepest decline on record in the second quarter of 2020. According to preliminary estimates published by the Bureau of Economic Analysis today, real GDP declined by a historic 32.9 percent at an annualized rate in the three months ended June 30, making the previous negative record set in Q1 1958 look like a small dip in comparison.
“The decline in second quarter GDP reflected the response to COVID-19, as “stay-at-home” orders issued in March and April were partially lifted in some areas of the country in May and June, and government pandemic assistance payments were distributed to households and businesses,” the BEA wrote with respect to the impact of the coronavirus pandemic. “This led to rapid shifts in activity, as businesses and schools continued remote work and consumers and businesses canceled, restricted, or redirected their spending.”
Considering that large parts of the U.S. have been on lockdown through April and parts of May, it had been widely expected that the fallout of the pandemic would only become fully apparent in the second quarter after economic output had dropped by “just” 5 percent in Q1. What makes today’s news of the unprecedented downturn even more alarming, is the fact that it comes at a time when cases and deaths are rising again, sparking fears of a second lockdown.
Back in April, when the first estimate for Q1 GDP growth was published, hopes of a quick recovery were still high as daily new infections had stopped growing and were starting to trend downwards if anything. Three months later, however, daily new cases are higher than ever, deaths are trending upwards, and 20+ million jobless Americans face a steep drop-off in personal income as Congress has yet to agree on an extension of the weekly $600 boost to regular unemployment benefits.
 You will find more infographics at Statista